
The 5 Most Expensive U.S. Cities for Homeowners
It’s no secret that the dream of home ownership is increasingly a daunting prospect. From overwhelming student loan debt, to less-than-stellar credit scores, to steadily-climbing home prices, there’s no shortage of factors keeping a lot of us from achieving that hallmark of adulthood.
However, some markets are tougher to pull off this particular aspect of “adulting” in than others. RealtyHop, a real estate search engine, just released their first-ever Housing Affordability Index, ranking the top 100 metropolitan areas in the U.S. by each city’s cost burden for homeowners. If you live in one of the nation’s costly urban hubs, you won’t be surprised to read, that according to the analysis, homeowners in the most expensive cities need to shell out around half of their income on housing—or more.
For the analysis, the folks at RentalHop analyzed more than 300,000 for-sale listings alongside American Community Survey Census data to identify each major metropolitan area’s homeownership burden. They defined this burden as the percentage of income homeowners must spend, on average, on housing costs (estimated property tax burden plus mortgage expenses for a 4.5 percent, 30-year mortgage with a 20 percent down payment) relative to the area’s median income.
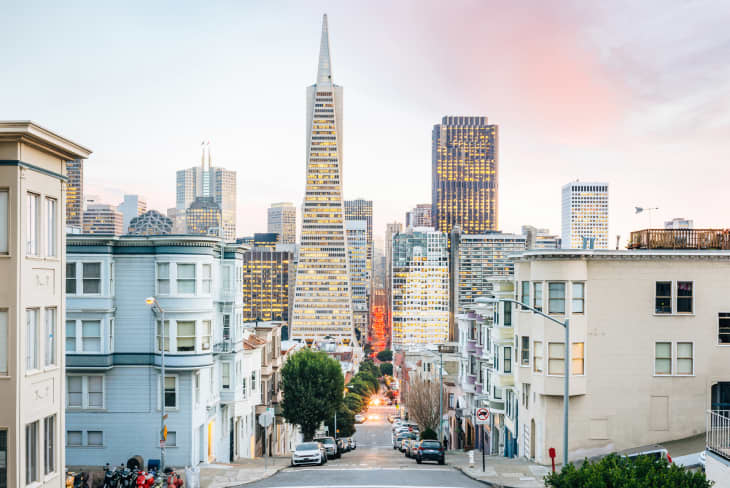
Notably, eight of the top 15 least affordable markets for homeowners were in California. The least affordable place? San Jose, where owning residents can expect to spend more than 60 percent of their annual income on their homes. It’s followed by New York City, where despite residents’ relative high earnings, high property costs and taxes drive up the monthly housing bill. NYC homeowners spend 54 percent of their income on housing costs, followed by Los Angeles, where homeowners spend just slightly less (52 percent). The top five toughest markets are rounded out by San Francisco (51 percent) and San Diego (49 percent).
Generally, experts say that your monthly housing payment as a homeowner should be no greater than 28 percent of your pre-tax monthly income in order to be able to comfortably pay for any unexpected repairs or other costs that may arise.
Related: 7 Things Real Estate Agents Wish You Knew
On the other end of the spectrum, some smaller metro areas are nicer to homeowners’ pockets. The most affordable market for homeowners is Scranton, Pennsylvania, where residents spend just 14.6 percent of their income on housing, which is only narrowly above the second most-affordable city of Wichita, Kansas (15 percent).
Little Rock, Arkansas, which LendingTree ranked as the best city for first-time homebuyers last year, is the third most affordable city on RealtyHop’s list, with residents spending just 15.5 percent of their income on housing. In Dayton, Ohio, which snagged a spot on Lending Tree’s list of the best cities for first-time homebuyers in 2019, owners spend just a little more at 15.8 percent. Jackson, Mississippi rounds out the list as the fifth most-affordable market at 16 percent.
Not sure you want to move to Scranton but do want to find a place to buy without sacrificing half of your paycheck? Leave it up to your personality. Here, the best affordable city to live for every Myers-Briggs type.